Try this. All loops are for loops, so you can easily add more calculations.
#Set the number of bets and number of trials and % lines
numbet <- 6000 #6000 bets
numtri <- 1000 #Run 1000 trials of the 6000 bets
perlin <- 0.05 #Show the +/- 5% lines on the graph
rantri <- 60 #The 60th trial (just a random trial to be drawn)

#Fill a matrix where the rows are the cumulative bets and the columns are the trials
xcum <- matrix(NA, nrow=numbet, ncol=numtri)
for (i in 1:numtri) {
  x <- sample(c(-1,1), numbet, replace = TRUE)
  xcum[,i] <- cumsum(x)
}

#Plot the trials as transparent lines so you can see the build up
matplot(xcum, type="l", xlab="Number of Bets", ylab="Cumulative Sum", main="Cumulative Results", col=rgb(0.01, 0.01, 0.01, 0.02))
grid()

#Sort the trials of each bet so you can pick out the desired %
xcumsor <- xcum
for (i in 1:numbet) {
  xcumsor[i,] <- xcum[i,order(xcum[i,])]
}

#Draw the upper/lower limit lines and the 50% probability line
lines(xcumsor[, perlin*numtri], type="l", lwd=2, col=rgb(1, 0.0, 0.0)) #Lower limit
lines(xcumsor[, 0.5*numtri], type="l", lwd=3, col=rgb(0, 1, 0.0)) #50% Line
lines(xcumsor[, (1-perlin)*numtri], type="l", lwd=2, col=rgb(1, 0.0, 0.0)) #Upper limit

#Show one of the trials
lines(xcum[, rantri], type="l", lwd=1, col=rgb(1, 0.8, 0)) #Random trial

#Draw the legend
legend("bottomleft", legend=c("Various Trials", "Single Trial", "50% Probability", "Upper/Lower % Limts"), bg="white", lwd=c(1, 1, 3, 2), col=c("darkgray", "orange", "green", "red"))
Edit 1 ==========================================================
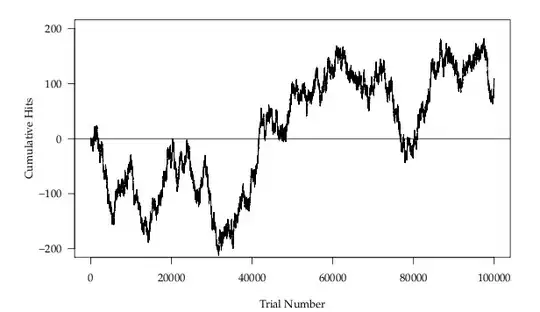
If you're just trying to draw the +/- 5% lines, it's just a square root function. Here's the code:
#Set the bet sequence and the % lines
betseq <- 1:100000 #1 to 100,000 bets
perlin <- 0.05 #Show the +/- 5% lines on the graph

#Calculate the Upper and Lower limits using perlin
#qnorm() gives the multiplier for the square root
upplim <- qnorm(1-perlin)*sqrt(betseq)
lowlim <- qnorm(perlin)*sqrt(betseq)

#Get the range for y
yran <- range(upplim, lowlim)

#Plot the upper and lower limit lines
plot(betseq, upplim, ylim=yran, type="l", xlab="", ylab="")
lines(betseq, lowlim)

Edit 2 ==================================================
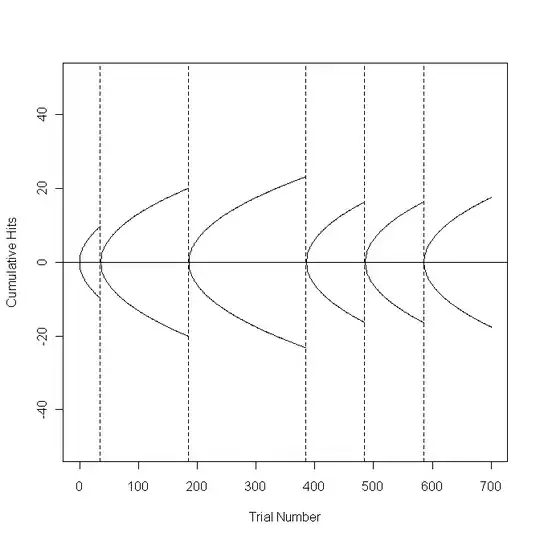
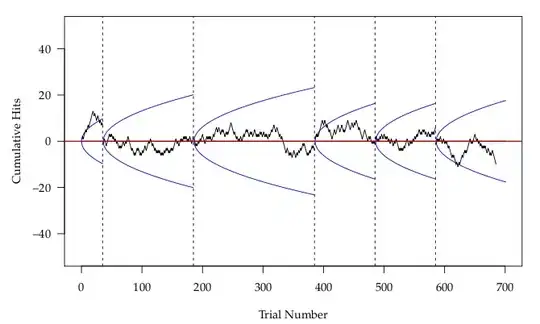
To add the parabolas at the right locations, it is probably easier if you define a function. Keep in mind that because the new function (dralim) uses lines, the plot has to exist before you call dralim. Using some of the same variables as the code in Edit 1:
#Set the bet sequence and the % lines
betseq <- 0:700 #0 to 700 bets
perlin <- 0.05 #Show the +/- 5% lines on the graph

#Define a function that plots the upper and lower % limit lines
dralim <- function(stax, endx, perlin) {
  lines(stax:endx, qnorm(1-perlin)*sqrt((stax:endx)-stax))
  lines(stax:endx, qnorm(perlin)*sqrt((stax:endx)-stax))
}

#Build the plot area and draw the vertical dashed lines
plot(betseq, rep(0, length(betseq)), type="l", ylim=c(-50, 50), main="", xlab="Trial Number", ylab="Cumulative Hits")
abline(h=0)
abline(v=35, lty="dashed") #Seg 1
abline(v=185, lty="dashed") #Seg 2
abline(v=385, lty="dashed") #Seg 3
abline(v=485, lty="dashed") #Seg 4
abline(v=585, lty="dashed") #Seg 5

#Draw the % limit lines that correspond to the vertical dashed lines by calling the
#new function dralim.
dralim(0, 35, perlin) #Seg 1
dralim(36, 185, perlin) #Seg 2
dralim(186, 385, perlin) #Seg 3
dralim(386, 485, perlin) #Seg 4
dralim(486, 585, perlin) #Seg 5
dralim(586, 701, perlin) #Seg 6