36

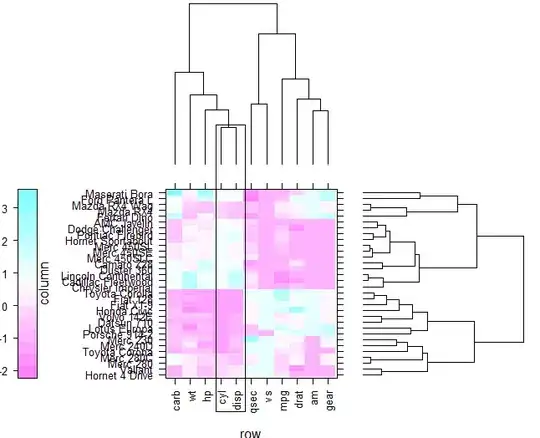
Is this possible to reproduce this lattice plot with ggplot2?

library(latticeExtra)
data(mtcars)
x  <- t(as.matrix(scale(mtcars)))
dd.row <- as.dendrogram(hclust(dist(x)))
row.ord <- order.dendrogram(dd.row)

dd.col <- as.dendrogram(hclust(dist(t(x))))
col.ord <- order.dendrogram(dd.col)

library(lattice)

levelplot(x[row.ord, col.ord],
      aspect = "fill",
      scales = list(x = list(rot = 90)),
      colorkey = list(space = "left"),
      legend =
      list(right =
           list(fun = dendrogramGrob,
                args =
                list(x = dd.col, ord = col.ord,
                     side = "right",
                     size = 10)),
           top =
           list(fun = dendrogramGrob,
                args =
                list(x = dd.row,
                     side = "top",
                     size = 10))))

enter image description here

hello_there_andy
  • 2,039
  • 2
  • 21
  • 51
MYaseen208
  • 22,666
  • 37
  • 165
  • 309
  • have you tried anything thus far? – Chase Jul 13 '11 at 01:58
  • 1
    my guess: possible (**everything** is possible), not easy. Someone has done some phylogenies in ggplot2 and there may be other code for drawing dendrograms. You probably have to do the pieces and put them together with `grid` graphics ... Actually, since you've already got `dendrogramGrobs`, you may be able to make the middle piece with `geom_tile` and then put the pieces together with functions from `ggExtra` and `gridExtra` ... – Ben Bolker Jul 13 '11 at 01:59
  • 1
    @BenBolker As you say, everything is possible. And in this case it has just become a little bit easier. See my answer: http://stackoverflow.com/questions/6673162/reproducing-lattice-dendrogram-graph-with-ggplot2/6675983#6675983 – Andrie Jul 13 '11 at 09:36

4 Answers4

52

EDIT

From 8 August 2011 the ggdendro package is available on CRAN Note also that the dendrogram extraction function is now called dendro_data instead of cluster_data


Yes, it is. But for the time being you will have to jump through a few hoops:

  1. Install the ggdendro package (available from CRAN). This package will extract the cluster information from several types of cluster methods (including Hclust and dendrogram) with the express purpose of plotting in ggplot.
  2. Use grid graphics to create viewports and align three different plots.

enter image description here

The code:

First load the libraries and set up the data for ggplot:

library(ggplot2)
library(reshape2)
library(ggdendro)

data(mtcars)
x <- as.matrix(scale(mtcars))
dd.col <- as.dendrogram(hclust(dist(x)))
col.ord <- order.dendrogram(dd.col)

dd.row <- as.dendrogram(hclust(dist(t(x))))
row.ord <- order.dendrogram(dd.row)

xx <- scale(mtcars)[col.ord, row.ord]
xx_names <- attr(xx, "dimnames")
df <- as.data.frame(xx)
colnames(df) <- xx_names[[2]]
df$car <- xx_names[[1]]
df$car <- with(df, factor(car, levels=car, ordered=TRUE))

mdf <- melt(df, id.vars="car")

Extract dendrogram data and create the plots

ddata_x <- dendro_data(dd.row)
ddata_y <- dendro_data(dd.col)

### Set up a blank theme
theme_none <- theme(
  panel.grid.major = element_blank(),
  panel.grid.minor = element_blank(),
  panel.background = element_blank(),
  axis.title.x = element_text(colour=NA),
  axis.title.y = element_blank(),
  axis.text.x = element_blank(),
  axis.text.y = element_blank(),
  axis.line = element_blank()
  #axis.ticks.length = element_blank()
)

### Create plot components ###    
# Heatmap
p1 <- ggplot(mdf, aes(x=variable, y=car)) + 
  geom_tile(aes(fill=value)) + scale_fill_gradient2()

# Dendrogram 1
p2 <- ggplot(segment(ddata_x)) + 
  geom_segment(aes(x=x, y=y, xend=xend, yend=yend)) + 
  theme_none + theme(axis.title.x=element_blank())

# Dendrogram 2
p3 <- ggplot(segment(ddata_y)) + 
  geom_segment(aes(x=x, y=y, xend=xend, yend=yend)) + 
  coord_flip() + theme_none

Use grid graphics and some manual alignment to position the three plots on the page

### Draw graphic ###

grid.newpage()
print(p1, vp=viewport(0.8, 0.8, x=0.4, y=0.4))
print(p2, vp=viewport(0.52, 0.2, x=0.45, y=0.9))
print(p3, vp=viewport(0.2, 0.8, x=0.9, y=0.4))
Andrie
  • 176,377
  • 47
  • 447
  • 496
  • very nice. Would be nice to (1) move the legend out of the way somewhere and (2) expand the geom_tile() so it filled the whole panel (I think these are both doable, #2 internally and #1 with `ggExtra` tricks ...) – Ben Bolker Jul 13 '11 at 15:03
  • @BenBolker, yes indeed. This is the beauty of ggplot, isn't it? Once the data is in the desired format, one can manipulate all of the plot format... – Andrie Jul 13 '11 at 15:57
  • 1
    @Andrie: When this R package will be available to install? Actually I want to use this package but don't know how to build this after downloading. Thanks – MYaseen208 Jul 26 '11 at 01:23
  • @MYaseen208 The `ggdendro` package is now available on CRAN: http://cran.r-project.org/web/packages/ggdendro/index.html – Andrie Aug 08 '11 at 08:10
  • Is this possible to display the variable labels and car label under the corresponding segments of the dendrogram? Thanks for your help. – MYaseen208 Aug 26 '11 at 06:48
  • 2
    This is awesome! Wish there was a function for this! I was wondering if there was a way to get the dendogram size to match the tile plot size? Manually adjusting the viewport size and location is tedious and does not work perfectly, but it should be possible to do it from the info within the plots :(http://stackoverflow.com/questions/13867325/get-width-of-plot-area-in-ggplot2?rq=1 and http://stackoverflow.com/questions/13294952/left-align-two-graph-edges-ggplot?lq=1) – Etienne Low-Décarie Jun 26 '13 at 21:18
  • there is something wrong with the above code. > print(p2, vp=viewport(0.52, 0.2, x=0.45, y=0.9)) Error in eval(expr, envir, enclos) : object 'x0' not found > print(p3, vp=viewport(0.2, 0.8, x=0.9, y=0.4)) Error in eval(expr, envir, enclos) : object 'x0' not found – eastafri Dec 21 '13 at 17:40
  • I have the same problem as @eastafri. Did we miss something here? – Lilith-Elina Jan 13 '14 at 15:53
  • Wait, I got it. Must be connected with the usage of the new `dendro_data` function. Instead of x0 and x1 you need to use x and xend. Same for y. – Lilith-Elina Jan 13 '14 at 16:05
  • 1
    @Lilith-Elina Thank you for identifying that fix. I have updated the answer to reflect this, and also to conform to the current release of `ggplot2`, i.e. no theme warnings. – Andrie Jan 13 '14 at 20:22
  • 2
    Thanks for the corrections. One also needs to load the gridExtra package. Additionally my dendrogram along the x-axis is not properly aligned. anyone else who got something like that? – eastafri Jan 14 '14 at 14:42
  • You're welcome. :-) Yes, you also need gridExtra, and you have to align the dendrogram manually with the viewport options. I had to tweak mine as well from the example. By the way, does anyone know how you get the dendrogram _closer_ to the heatmap? The distance is a bit wide and when I try to close it I loose data points from the heatmap. – Lilith-Elina Jan 15 '14 at 09:43
  • Hi, I have another question about this... Would it be possible to add another figure into that plot? For a publication, I need to combine a histogram and such a heat map in one... – Lilith-Elina Jan 29 '14 at 11:54
  • @Lilith-Elina Yes, use grid viewports. Look here for inspiration: http://stackoverflow.com/questions/8112208/how-can-i-obtain-an-unbalanced-grid-of-ggplots – Andrie Jan 29 '14 at 12:08
  • I would have loved to use grid.arrange instead! But I've more or less figured it out with viewports now, thanks. – Lilith-Elina Jan 30 '14 at 16:11
  • Is there a way to align the dendrograms without manually setting the viewport sizes, like @EtienneLow-Décarie is suggesting? Reviving an old thread here, but can't seem to find an answer out there. – Daniel Apr 29 '14 at 16:46
  • Recent versions of ggdendro seem to contain a theme_dendro object, which you can use instead of defining a theme_none as in the example. This should shorten the code. – dalloliogm Oct 21 '15 at 09:19
6

As Ben says, everything is possible. Some work to support dendrograms has been done. Andrie de Vries has made a fortify method of tree objects. However, the resulting graphic is not pretty as you can see.

The tile would be easy to do. For the dendrogram I would inspect plot.dendrogram (using getAnywhere) to see how the coordinates for the segments are calculated. Extract those coordinates and use geom_segment to plot the dendrogram. Then use viewports to plot the tiles and the dendrogram together. Sorry I can't give a example, it's a lot of work and it's too late.

I hope this helps

Cheers

dendrogram

Community
  • 1
  • 1
Luciano Selzer
  • 9,806
  • 3
  • 42
  • 40
4

Doubtful. I do not see any functions in the Index for ggplot2 that would suggest support for dendrograms, and when this blogger put together a set of translations of the illustrations in Sarkar's Lattice book, he was unable to get a ggplot dendrogram legend:

http://learnr.wordpress.com/2009/08/10/ggplot2-version-of-figures-in-lattice-multivariate-data-visualization-with-r-part-9/

IRTFM
  • 258,963
  • 21
  • 364
  • 487
  • I think some people have hacked together some solutions that at least would be good starting points: see [here](http://stats.stackexchange.com/questions/4062/how-to-plot-a-fan-polar-dendrogram-in-r), [here](http://groups.google.com/group/ggplot2/browse_thread/thread/8e1efd0e7793c1bb) and possibly [this](http://groups.google.com/group/ggplot2/browse_thread/thread/6153bcadb715dac2/0999db6d11856823) might be of some use as well. – joran Jul 13 '11 at 02:53
  • 3
    @DWin Never say never. See my answer: http://stackoverflow.com/questions/6673162/reproducing-lattice-dendrogram-graph-with-ggplot2/6675983#6675983 – Andrie Jul 13 '11 at 09:37
1

These links provide a solution for heatmaps with dendrograms in ggplot2:

https://gist.github.com/chr1swallace/4672065

https://github.com/chr1swallace/random-functions/blob/master/R/ggplot-heatmap.R

and also this one:

Align ggplot2 plots vertically

Community
  • 1
  • 1
waferthin
  • 1,582
  • 1
  • 16
  • 27