I'm not sure if I am interpreting your second question properly, but assuming you require a list of (x,y) points from the generated ContourPlot, one way of doing this might be the following:
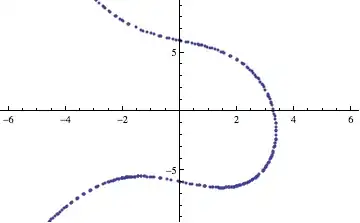
plot = ContourPlot[
  x^3 + x*y + y^2 - 36 == 0, {x, -2 Pi, 2 Pi}, {y, -3 Pi, 3 Pi}]
To obtain a list of points
points = Cases[Normal@plot, x_Line :> First@x, Infinity];
'Take a look' with ListPlot
ListPlot[points, PlotRange -> {{-2 Pi, 2 Pi}, {-3 Pi, 3 Pi}}]
giving
Edit
Nasser has correctly pointed out that this question has been addressed before. Here is one link to essentially the same question and this answer by Szabolcs is relevant.
As regards the answer given above, this method is probably more direct:
points2 = Cases[plot, x_GraphicsComplex :> First@x, Infinity]
Finally, I should acknowledge " LunchTime Playground. Fun with Mathematica: How to extract points from a plot", see here, which gives both methods suggested above (and which I now use routinely).
Edit 2
This method is an improvement on method 1 above, as the points are obtained as a list of {x,y} values (list-of-lists) without any extraneous { }.
Cases[Normal@plot, Line[{x__}] :> x, Infinity]
An article by Paul Abbott in the Mathematica Journal Vol 7, No 2, pp 108-112, 1998,
Finding Roots in an Interval, gives a lot of useful information and is available here
He points out the the following also work
Cases[Normal@plot, _Line, -1][[1, 1]]
and(!)
plot[[1, 1]]
I have made reference in the comments to the question by FreshApple where a (slight variant) of the following method may be found:
InputForm[plot][[1, 1, 1]]
The following evaluates to True
plot[[1, 1]] == Cases[Normal@plot, Line[{x__}] :> x, Infinity] ==
 InputForm[plot][[1, 1, 1]] == Cases[Normal@plot, _Line, -1][[1, 1]]
Edit 3
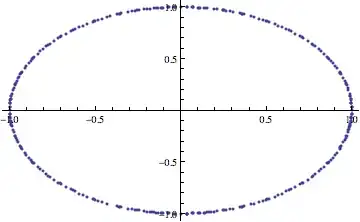
Just or fun ...
ListPlot@ContourPlot[x^2 + y^2 == 1, {x, -1, 1}, {y, -1, 1}][[1, 1]]
gives