7

I am creating a Django app and want to have visualizations of a social network. I'm looking for a library that can draw a graph/network data structure, but also make it interactive. I'd like to be able to click on a node and have information from that node be displayed (Name, Network, etc) somewhere else on the page

So far I've found python-graph and graphviz to be very powerful visualization tools, but they create static images, so you can't click on them. I've also found this thread

Graph visualization library in JavaScript

which had a lot of suggestions, but some of them are for graphs as in charts, not graph as in social network graph. Some of them are very old, and some of them are interactive only in that the node can be dragged and moved elsewhere on a canvas. I don't care so much about the user being able to change the graph, I'd just like to have the node object carry data with it that can be displayed somewhere.

Any suggestions?

Community
  • 1
  • 1
JCWong
  • 1,163
  • 1
  • 10
  • 29

4 Answers4

6

I did something similar using PyGraphviz. You can save the graph as SVG and show the SVG in your website. Then you can use something like jQuery SVG to attach handlers to the nodes.

I implemented a more flexible solution and serialized all nodes and edges to a JSON format and sent it to the website. Then I draw the graph using Raphaël. This solution is cross-browser compatible and very flexible.

Josir
  • 1,282
  • 22
  • 35
Reto Aebersold
  • 16,306
  • 5
  • 55
  • 74
3

Checkout also django-netjsongraph.

nemesisdesign
  • 8,159
  • 12
  • 58
  • 97
2

I like d3. Here's an example of a force-directed graph (often used to display social networks).

It would be fairly easy to add the kind of click handling you're seeking to the d3 force example.

Beau
  • 11,267
  • 8
  • 44
  • 37
1

The library d3graph will build a force-directed d3-graph from within python. You can "break" the network based on the edge weight, and hover over the nodes for more information. Double click on a node will focus on the node and its connected edges.

pip install d3graph

Example:

# Import library
from d3graph import d3graph, vec2adjmat

source = ['node A','node F','node B','node B','node B','node A','node C','node Z']
target = ['node F','node B','node J','node F','node F','node M','node M','node A']
weight = [5.56, 0.5, 0.64, 0.23, 0.9,3.28,0.5,0.45]

# Convert to adjacency matrix
adjmat = vec2adjmat(source, target, weight=weight)

print(adjmat)
# target  node A  node B  node F  node J  node M  node C  node Z
# source                                                        
# node A    0.00     0.0    5.56    0.00    3.28     0.0     0.0
# node B    0.00     0.0    1.13    0.64    0.00     0.0     0.0
# node F    0.00     0.5    0.00    0.00    0.00     0.0     0.0
# node J    0.00     0.0    0.00    0.00    0.00     0.0     0.0
# node M    0.00     0.0    0.00    0.00    0.00     0.0     0.0
# node C    0.00     0.0    0.00    0.00    0.50     0.0     0.0
# node Z    0.45     0.0    0.00    0.00    0.00     0.0     0.0

# Initialize
d3 = d3graph()

# Process adjacency matrix
d3.graph(adjmat)
d3.show()

# Example B: Color nodes
d3.set_node_properties(color=adjmat.columns.values, size=size)
d3.show()

# Example C: include node size
size = [10,20,10,10,15,10,5]
d3.set_node_properties(color=adjmat.columns.values, size=size)
d3.show()

# Example D: include node-edge-size
d3.set_node_properties(color=adjmat.columns.values, size=size, edge_size=size[::-1], cmap='Set2')
d3.show()

# Example E: include node-edge color
d3.set_node_properties(color=adjmat.columns.values, size=size, edge_size=size[::-1], edge_color='#000000')
d3.show()

# Example F: Change colormap
d3.set_node_properties(color=adjmat.columns.values, size=size, edge_size=size[::-1], edge_color='#00FFFF', cmap='Set2')
d3.show()

# Example G: Include directed links. Arrows are set from source -> target
d3.set_edge_properties(directed=True)
d3.set_node_properties(color=adjmat.columns.values, size=size, edge_size=size, edge_color='#000FFF', cmap='Set1')
d3.show()
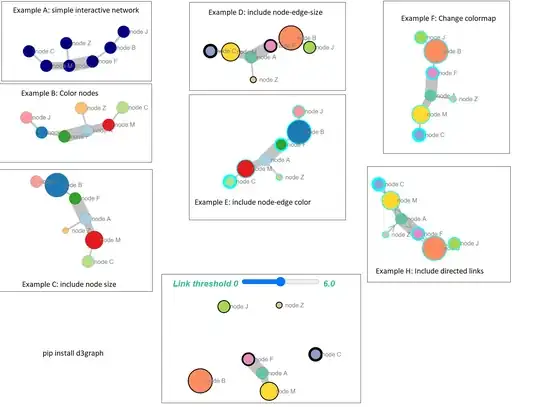
Examples of d3graph

  • More examples and information can be found at the github documentation pages.
  • Interactive example from the titanic-case can be found here.
  • If you need more context how d3graph is developed, read the blog here.
erdogant
  • 1,544
  • 14
  • 23
  • this answer does not explain how to modify the structure of the graph after creation. if it is possible, can you please elaborate? – mo FEAR Mar 04 '22 at 12:27
  • I updated the examples. With d3.set_node_properties() you can change the properties. Plotting can be done with d3.show() – erdogant Mar 05 '22 at 09:04
  • thx I'll give it a try later – mo FEAR Mar 06 '22 at 13:30
  • the examples only demonstrate changing the weights. it assumes however that the existence of nodes and edges remains unchanged. this isn't what i meant. i was looking for a way to change the adjacency matrix itself iteratively on demand. is this possible? – mo FEAR Mar 10 '22 at 14:57
  • The adjacency matrix can not be changed after the network is created. It should be done outside this library, and then run it again. You can provide the destination path to keep the link the same. – erdogant Mar 11 '22 at 15:38