305

I'm trying to use matplotlib to read in an RGB image and convert it to grayscale.

In matlab I use this:

img = rgb2gray(imread('image.png'));

In the matplotlib tutorial they don't cover it. They just read in the image

import matplotlib.image as mpimg
img = mpimg.imread('image.png')

and then they slice the array, but that's not the same thing as converting RGB to grayscale from what I understand.

lum_img = img[:,:,0]

I find it hard to believe that numpy or matplotlib doesn't have a built-in function to convert from rgb to gray. Isn't this a common operation in image processing?

I wrote a very simple function that works with the image imported using imread in 5 minutes. It's horribly inefficient, but that's why I was hoping for a professional implementation built-in.

Sebastian has improved my function, but I'm still hoping to find the built-in one.

matlab's (NTSC/PAL) implementation:

import numpy as np

def rgb2gray(rgb):

    r, g, b = rgb[:,:,0], rgb[:,:,1], rgb[:,:,2]
    gray = 0.2989 * r + 0.5870 * g + 0.1140 * b

    return gray
Mark Amery
  • 143,130
  • 81
  • 406
  • 459
waspinator
  • 6,464
  • 11
  • 52
  • 78
  • 2
    Note that you can write the same thing as your rgb2gray function simply as: `gray = np.mean(rgb, -1)`. Maybe `rgb[...,:3]` there if it is actually rgba. – seberg Aug 31 '12 at 01:00
  • hmm, `gray = np.mean(rgb, -1)` works fine. thanks. Is there any reason not to use this? Why would I use the solutions in the answers below instead? – waspinator Aug 31 '12 at 01:22
  • 7
    The [grayscale wikipedia page](http://en.wikipedia.org/wiki/Grayscale#Converting_color_to_grayscale) says the method of converting RGB to grayscale is not unique, but gives a commonly used formulas based on luminance. It is quite different than `np.mean(rgb, -1)`. – unutbu Aug 31 '12 at 01:32
  • 3
    so I guess I want [Matlab's version](http://www.mathworks.com/help/toolbox/images/ref/rgb2gray.html)? `0.2989 * R + 0.5870 * G + 0.1140 * B ` I'm assuming that it's the standard way of doing it. – waspinator Aug 31 '12 at 01:37
  • 1
    Shouldn't be 0.2990 * R + 0.5870 * G + 0.1140 * B instead? The weight sum should equal to 1 and not 0.9999. Check here: https://en.wikipedia.org/wiki/Grayscale – Alexandre Cartaxo Oct 17 '20 at 16:23
  • You can find a detailed discussion on different methods of converting an image to grayscale here - https://e2eml.school/convert_rgb_to_grayscale.html – truth Mar 18 '21 at 06:52

15 Answers15

456

How about doing it with Pillow:

from PIL import Image
img = Image.open('image.png').convert('L')
img.save('greyscale.png')

If an alpha (transparency) channel is present in the input image and should be preserved, use mode LA:

img = Image.open('image.png').convert('LA')

Using matplotlib and the formula

Y' = 0.2989 R + 0.5870 G + 0.1140 B 

you could do:

import numpy as np
import matplotlib.pyplot as plt
import matplotlib.image as mpimg

def rgb2gray(rgb):
    return np.dot(rgb[...,:3], [0.2989, 0.5870, 0.1140])

img = mpimg.imread('image.png')     
gray = rgb2gray(img)    
plt.imshow(gray, cmap=plt.get_cmap('gray'), vmin=0, vmax=1)
plt.show()
Corralien
  • 109,409
  • 8
  • 28
  • 52
unutbu
  • 842,883
  • 184
  • 1,785
  • 1,677
  • 3
    If he has to use `matplotlib` for some other reason, he should be able to use the builtin `colorsys.rgb_to_yiq()` to transform plus a slice to get just the luma channel. – Silas Ray Aug 30 '12 at 16:53
  • 46
    why `.convert('LA')`? why not `.convert('gray')`? Seems needlessly cryptic. The [PIL documentation](http://www.pythonware.com/library/pil/handbook/image.htm) doesn't mention anything about 'LA' for the convert function. – waspinator Aug 31 '12 at 01:32
  • 1
    Any reason why you chose to use rollaxis instead of an array slice? Is it supposed to be faster? Slices seem to be more readable. I'm still surprised that rgb2gray hasn't been implemented in the library yet. I guess this is the best I can hope for, for now. Thanks. – waspinator Aug 31 '12 at 02:17
  • Although array slices like `r = rgb[...,0]` might be more readable (and the code may even be a bit faster), writing it out for `r`, `g` and `b` is a bit repetitive, and would not generalize well to more variables. I think either way has its advantages. – unutbu Aug 31 '12 at 12:21
  • 30
    using PIL: `cannot write mode LA as JPEG`, I needed to use L mode not LA – jsky May 26 '15 at 06:50
  • 3
    To get the exact same results as with [Matlab's version](http://stackoverflow.com/questions/12201577/how-can-i-convert-an-rgb-image-into-grayscale-in-python/12201744#comment16351468_12201577) (which differs marginally from the [ITU-R 601-2 luma transform](http://pillow.readthedocs.io/en/3.2.x/reference/Image.html#PIL.Image.Image.convert), I specified an adjusted matix: `img.convert('L', (0.2989, 0.5870, 0.1140, 0))`. – dtk Aug 04 '16 at 14:12
  • 11
    This `img = Image.open('image.png').convert('LA')` needs to be `img = Image.open('image.png').convert('L')` – nviens Oct 23 '17 at 22:05
  • What is LA? Specifically what is L with alpha? – BluePython Nov 08 '17 at 06:44
  • 18
    @BluePython: `LA` mode has luminosity (brightness) and alpha. If you use `LA` mode, then `greyscale.png` will be an RGBA image with the alpha channel of `image.png` preserved. If you use `L` mode, then `greyscale.png` will be an RGB image (with no alpha). – unutbu Nov 08 '17 at 12:31
  • 2
    In case it matters for anyone's use-case, note that `LA` is an 8-bit mode and so `.convert('LA')` will reduce your color depth to 8-bit if it was originally higher. – Mark Amery Feb 20 '18 at 22:55
  • Updated link for @waspinator's comments: https://pillow.readthedocs.io/en/stable/handbook/concepts.html#concept-modes – Trenton Jan 12 '19 at 00:57
  • I have seen this RGB arrangement (0.299R, 0.587B, 0.114G) in a couple of documentations, yet whatever RGB values I use in `np.dot(rgb[...,:3], [0.299, 0.587, 0.114])`, .e.g. 0.9, 0.9, 0.9 ... even 0.0, 0.1., 0.0 (There must be at least a non zero value) the result is always the same! Not for you? Any idea why? – Apostolos Mar 18 '19 at 08:06
  • @Apostolos: Thanks for pointing out this bug. The results are different, but depending on your image, not as different as they should be. `imshow` ["normalizes"](https://matplotlib.org/api/_as_gen/matplotlib.colors.Normalize.html#matplotlib-colors-normalize) scalar data by default. Thus multiplying by `[0.0, 0.1, 0.0]` was equivalent to multiplying by `[0, 1, 0]` after normalization. To prevent `imshow` from doing this rescaling, use `vmin=0, vmax=1`. I've made this change above too. – unutbu Mar 18 '19 at 11:57
  • @unutbu, this is a great solution. Now we can talk! Note however, that -- with me at least -- it works only with `matplotlib.image` and with PNG files. It doesn't work with `imageio` and JPEG files. But who cares? :) – Apostolos Mar 19 '19 at 17:55
99

You can also use scikit-image, which provides some functions to convert an image in ndarray, like rgb2gray.

from skimage import color
from skimage import io

img = color.rgb2gray(io.imread('image.png'))

Notes: The weights used in this conversion are calibrated for contemporary CRT phosphors: Y = 0.2125 R + 0.7154 G + 0.0721 B

Alternatively, you can read image in grayscale by:

from skimage import io
img = io.imread('image.png', as_gray=True)
yangjie
  • 6,619
  • 1
  • 33
  • 40
  • is it normal that I'm getting 0 – Sam Dec 01 '15 at 20:24
  • knowing that my aim is to use GLCM features (greycoprops) – Sam Dec 01 '15 at 20:56
  • Note for io.imread: "as_grey" has been deprecated in favor of "as_gray". Same usage, just Americanized spelling. :) – Halogen Mar 30 '19 at 20:06
  • 1
    I believe this is the most useful answer to question at hand, output of this is also compatible with matplotlib and numpy. – Mert Beşiktepe Nov 14 '19 at 21:31
  • I am using the color object but my image is sort of reddish now and not gray (black and white). I need to use `cmap` as `gray' then only the image is shown as gray in `pyplot.imshow()` ? Any thoughts ? Where am I wrong? – GadaaDhaariGeek Jan 17 '20 at 14:55
90

Three of the suggested methods were tested for speed with 1000 RGBA PNG images (224 x 256 pixels) running with Python 3.5 on Ubuntu 16.04 LTS (Xeon E5 2670 with SSD).

Average run times

pil : 1.037 seconds

scipy: 1.040 seconds

sk : 2.120 seconds

PIL and SciPy gave identical numpy arrays (ranging from 0 to 255). SkImage gives arrays from 0 to 1. In addition the colors are converted slightly different, see the example from the CUB-200 dataset.

SkImage: SkImage

PIL : PIL

SciPy : SciPy

Original: Original

Diff : enter image description here

Code

  1. Performance

    run_times = dict(sk=list(), pil=list(), scipy=list())
    for t in range(100):
        start_time = time.time()
        for i in range(1000):
            z = random.choice(filenames_png)
            img = skimage.color.rgb2gray(skimage.io.imread(z))
        run_times['sk'].append(time.time() - start_time)
    
    
    start_time = time.time()
    for i in range(1000):
        z = random.choice(filenames_png)
        img = np.array(Image.open(z).convert('L'))
    run_times['pil'].append(time.time() - start_time)
    
    start_time = time.time()
    for i in range(1000):
        z = random.choice(filenames_png)
        img = scipy.ndimage.imread(z, mode='L')
    run_times['scipy'].append(time.time() - start_time)
    

    for k, v in run_times.items(): print('{:5}: {:0.3f} seconds'.format(k, sum(v) / len(v)))

  2. Output
    z = 'Cardinal_0007_3025810472.jpg'
    img1 = skimage.color.rgb2gray(skimage.io.imread(z)) * 255
    IPython.display.display(PIL.Image.fromarray(img1).convert('RGB'))
    img2 = np.array(Image.open(z).convert('L'))
    IPython.display.display(PIL.Image.fromarray(img2))
    img3 = scipy.ndimage.imread(z, mode='L')
    IPython.display.display(PIL.Image.fromarray(img3))
    
  3. Comparison
    img_diff = np.ndarray(shape=img1.shape, dtype='float32')
    img_diff.fill(128)
    img_diff += (img1 - img3)
    img_diff -= img_diff.min()
    img_diff *= (255/img_diff.max())
    IPython.display.display(PIL.Image.fromarray(img_diff).convert('RGB'))
    
  4. Imports
    import skimage.color
    import skimage.io
    import random
    import time
    from PIL import Image
    import numpy as np
    import scipy.ndimage
    import IPython.display
    
  5. Versions
    skimage.version
    0.13.0
    scipy.version
    0.19.1
    np.version
    1.13.1
    
Maximilian Peters
  • 30,348
  • 12
  • 86
  • 99
  • 13
    SciPy's image I/O is *literally* PIL/Pillow. Hence, testing SciPy is effectively retesting PIL/Pillow with negligible overhead introduced by SciPy's wrapper functions. It would have been *much* more useful to substitute OpenCV (which does *not* leverage PIL/Pillow) for SciPy (which does). Nonetheless, thanks for the dedicated benchmarking! The discernable slowdown imposed by SciKit is fascinating... **and horrifying.** – Cecil Curry Nov 16 '17 at 07:47
41

You can always read the image file as grayscale right from the beginning using imread from OpenCV:

img = cv2.imread('messi5.jpg', 0)

Furthermore, in case you want to read the image as RGB, do some processing and then convert to Gray Scale you could use cvtcolor from OpenCV:

gray_image = cv2.cvtColor(image, cv2.COLOR_BGR2GRAY)
Diamantatos Paraskevas
  • 3,874
  • 1
  • 20
  • 15
  • 12
    Ftr: The `0` flag is [`cv2.CV_LOAD_IMAGE_GRAYSCALE`](http://docs.opencv.org/2.4/modules/highgui/doc/reading_and_writing_images_and_video.html#cv2.imread). – dtk Aug 19 '16 at 23:25
29

The fastest and current way is to use Pillow, installed via pip install Pillow.

The code is then:

from PIL import Image
img = Image.open('input_file.jpg').convert('L')
img.save('output_file.jpg')
YPCrumble
  • 26,610
  • 23
  • 107
  • 172
12

The tutorial is cheating because it is starting with a greyscale image encoded in RGB, so they are just slicing a single color channel and treating it as greyscale. The basic steps you need to do are to transform from the RGB colorspace to a colorspace that encodes with something approximating the luma/chroma model, such as YUV/YIQ or HSL/HSV, then slice off the luma-like channel and use that as your greyscale image. matplotlib does not appear to provide a mechanism to convert to YUV/YIQ, but it does let you convert to HSV.

Try using matplotlib.colors.rgb_to_hsv(img) then slicing the last value (V) from the array for your grayscale. It's not quite the same as a luma value, but it means you can do it all in matplotlib.

Background:

Alternatively, you could use PIL or the builtin colorsys.rgb_to_yiq() to convert to a colorspace with a true luma value. You could also go all in and roll your own luma-only converter, though that's probably overkill.

Silas Ray
  • 25,682
  • 5
  • 48
  • 63
12

Using this formula

Y' = 0.299 R + 0.587 G + 0.114 B 

We can do

import imageio
import numpy as np
import matplotlib.pyplot as plt

pic = imageio.imread('(image)')
gray = lambda rgb : np.dot(rgb[... , :3] , [0.299 , 0.587, 0.114]) 
gray = gray(pic)  
plt.imshow(gray, cmap = plt.get_cmap(name = 'gray'))

However, the GIMP converting color to grayscale image software has three algorithms to do the task.

Innat
  • 16,113
  • 6
  • 53
  • 101
9

you could do:

import numpy as np
import matplotlib.pyplot as plt
import matplotlib.image as mpimg

def rgb_to_gray(img):
        grayImage = np.zeros(img.shape)
        R = np.array(img[:, :, 0])
        G = np.array(img[:, :, 1])
        B = np.array(img[:, :, 2])

        R = (R *.299)
        G = (G *.587)
        B = (B *.114)

        Avg = (R+G+B)
        grayImage = img.copy()

        for i in range(3):
           grayImage[:,:,i] = Avg
           
        return grayImage       

image = mpimg.imread("your_image.png")   
grayImage = rgb_to_gray(image)  
plt.imshow(grayImage)
plt.show()
xemexpress
  • 177
  • 1
  • 13
am.mansour
  • 91
  • 1
  • 2
8

If you're using NumPy/SciPy already you may as well use:

scipy.ndimage.imread(file_name, mode='L')

Ruaidhrí Primrose
  • 1,250
  • 1
  • 17
  • 22
dtk
  • 2,197
  • 2
  • 26
  • 19
  • 8
    Both `scipy.ndimage.imread()` and `scipy.misc.imread()` are [**formally deprecated**](https://docs.scipy.org/doc/scipy/reference/generated/scipy.ndimage.imread.html) in SciPy 1.0.0 and will be **permanently removed** in SciPy 1.2.0. While SciPy's documentation recommends [`imageio.imread()`](https://imageio.readthedocs.io/en/latest/userapi.html?highlight=imread#imageio.imread) as a suitable replacement, this function's API is bare bones to the point of absurdity. It provides *no* support for grayscale conversion and thus remains unsuitable for many applications – including ours. `` – Cecil Curry Nov 16 '17 at 07:39
5

Use img.Convert(), supports “L”, “RGB” and “CMYK.” mode

import numpy as np
from PIL import Image

img = Image.open("IMG/center_2018_02_03_00_34_32_784.jpg")
img.convert('L')

print np.array(img)

Output:

[[135 123 134 ...,  30   3  14]
 [137 130 137 ...,   9  20  13]
 [170 177 183 ...,  14  10 250]
 ..., 
 [112  99  91 ...,  90  88  80]
 [ 95 103 111 ..., 102  85 103]
 [112  96  86 ..., 182 148 114]]
naren
  • 14,611
  • 5
  • 38
  • 45
5

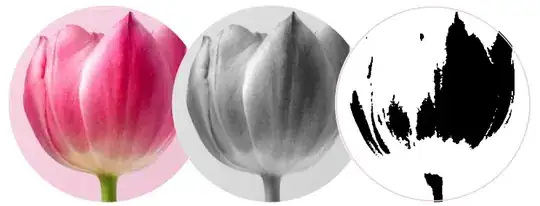
With OpenCV its simple:

import cv2

im = cv2.imread("flower.jpg")

# To Grayscale
im = cv2.cvtColor(im, cv2.COLOR_BGR2GRAY)
cv2.imwrite("grayscale.jpg", im)

# To Black & White
im = cv2.threshold(im, 127, 255, cv2.THRESH_BINARY)[1]
cv2.imwrite("black-white.jpg", im)

enter image description here

Shamshirsaz.Navid
  • 2,224
  • 3
  • 22
  • 36
3

I came to this question via Google, searching for a way to convert an already loaded image to grayscale.

Here is a way to do it with SciPy:

import scipy.misc
import scipy.ndimage

# Load an example image
# Use scipy.ndimage.imread(file_name, mode='L') if you have your own
img = scipy.misc.face()

# Convert the image
R = img[:, :, 0]
G = img[:, :, 1]
B = img[:, :, 2]
img_gray = R * 299. / 1000 + G * 587. / 1000 + B * 114. / 1000

# Show the image
scipy.misc.imshow(img_gray)
Martin Thoma
  • 124,992
  • 159
  • 614
  • 958
  • 1
    Nice. I just want to note the a shorter solution would be `img_gray = numpy.average(img, weights=[0.299, 0.587, 0.114], axis=2)` – Akavall Aug 04 '17 at 15:25
  • Both `scipy.ndimage.imread()` and `scipy.misc.imread()` are [**formally deprecated**](https://docs.scipy.org/doc/scipy/reference/generated/scipy.ndimage.imread.html) in SciPy 1.0.0 and will be **permanently removed** in SciPy 1.2.0. You probably just want to use Pillow's builtin grayscale conversion support (ala [unutbu](https://stackoverflow.com/users/190597/unutbu)'s [answer](https://stackoverflow.com/a/12201744/2809027)), instead. – Cecil Curry Nov 16 '17 at 07:51
  • What are the magic numbers in your code? 299, 587, 114... – Dave Kielpinski Sep 01 '21 at 16:52
2

When the values in a pixel across all 3 color channels (RGB) are same then that pixel will always be in grayscale format.

One of a simple & intuitive method to convert a RGB image to Grayscale is by taking the mean of all color channels in each pixel and assigning the value back to that pixel.

import numpy as np
from PIL import Image

img=np.array(Image.open('sample.jpg')) #Input - Color image
gray_img=img.copy()

for clr in range(img.shape[2]):
    gray_img[:,:,clr]=img.mean(axis=2) #Take mean of all 3 color channels of each pixel and assign it back to that pixel(in copied image)

#plt.imshow(gray_img) #Result - Grayscale image

Input Image: Input Image

Output Image: Output Image

0

Assuming my image is 3 channel in its original form

my_image = cv2.imread("./5d10e5939c5101174c54bb98.png")
#greyscaling the image
image_sum = my_image.sum(axis=2)
new_image = image_sum/image_sum.max() 

new_image is my single channel greyscale image

plt.figure(figsize=[12,8])
plt.imshow(new_image, cmap=plt.cm.gray)
plt.show()

[ This is without using cv2's cv2.COLOR_BGR2GRAY parameter or PIL's .convert('L') method ]

Prajot Kuvalekar
  • 5,128
  • 3
  • 21
  • 32
-3
image=myCamera.getImage().crop(xx,xx,xx,xx).scale(xx,xx).greyscale()

You can use greyscale() directly for the transformation.

techraf
  • 64,883
  • 27
  • 193
  • 198