15

Is it possible to alter the format of an individual facet plot? For example, using the sample code below, can one change the color of the title or background for the cyl=8 plot?

library(ggplot2)
ggplot(mtcars, aes(x=gear)) + 
  geom_bar(aes(y=gear), stat="identity", position="dodge") +
  facet_wrap(~cyl)
hrbrmstr
  • 77,368
  • 11
  • 139
  • 205
user338714
  • 2,315
  • 5
  • 27
  • 36
  • 1
    This question is similar and might provide inspiration: http://stackoverflow.com/q/3167444/602276 – Andrie Jul 19 '11 at 16:35

3 Answers3

19

You can modify the ggplot2 grobs, for instance:

library("ggplot2")
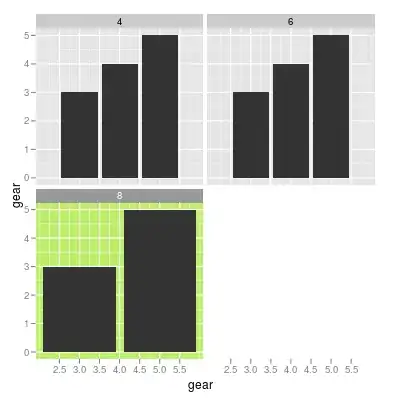
d <- ggplot(mtcars, aes(x=gear)) + 
       geom_bar(aes(y=gear), stat="identity", position="dodge") +
       facet_wrap(~cyl)

grob <- ggplotGrob(d)
strip_bg <- grid.ls(getGrob(grob, "strip.background.rect",
                            grep=TRUE, global=TRUE))$name
panel_bg <- grid.ls(getGrob(grob, "panel.background.rect",
                            grep=TRUE, global=TRUE))$name
strip_text <- grid.ls(getGrob(grob, "strip.text.x",
                              grep=TRUE, global=TRUE))$name
grob <- geditGrob(grob, strip_bg[2], gp=gpar(fill="gray60"))
grob <- geditGrob(grob, panel_bg[2], gp=gpar(fill="darkolivegreen2"))
grob <- geditGrob(grob, strip_text[2], gp=gpar(col="white"))
grid.draw(grob)

geditGrob example

Update: This should work with ggplot2 0.9.3

grob <- ggplotGrob(d)

elem <- grob$grobs$panel2
panel_bg <- grid.ls(getGrob(elem, "panel.background.rect", grep=TRUE))$name
grob$grobs$panel2 <- editGrob(elem, panel_bg, gp=gpar(fill="darkolivegreen"), grep=TRUE)

elem <- grob$grobs$strip_t.1
strip_bg <- grid.ls(getGrob(elem, "strip.background.rect", grep=TRUE))$name
grob$grobs$strip_t.1 <- editGrob(elem, strip_bg, gp=gpar(fill="gray60"), grep=TRUE)

elem <- grob$grobs$strip_t.1
strip_text <- grid.ls(getGrob(elem, "strip.text.x.text", grep=TRUE))$name
grob$grobs$strip_t.1 <- editGrob(elem, strip_text, gp=gpar(col="white"), grep=TRUE)

grid.draw(grob)
rcs
  • 67,191
  • 22
  • 172
  • 153
  • +1 but this no longer works (`grid.ls`). Do you have any idea how to update? – Simon O'Hanlon Jun 19 '13 at 18:13
  • @rcs I've been trying to rework facets of my graph (3 facets in columns using `facet_grid`)using your method. However when I try to use `panel_border <- grid.ls(getGrob(elem, "panel.border.rect", grep=TRUE))$name` I received an error: `Error in getGrob(elem, "panel.border.rect", grep = TRUE) : it is only valid to get a child from a "gTree"`. What might be causing such behaviour? – radek Aug 21 '13 at 22:24
  • 1
    @radek it's hard to say without a reproducible example. using `grid` is a fragile way to modify `ggplot2` graphics ... – rcs Aug 22 '13 at 07:34
  • @rcs Thanks for more details. It was just an attempt. And also made me think the same. Will try harder with the solutions that avoid `grid` then. – radek Aug 22 '13 at 08:52
  • 1
    @radek: when I got that error it was because the strips have been re-named to `strip_t1` rather than `strip_t.1`. However, this among other issues is leading me to think that this method is really too unstable to be desirable. – Jack Aidley Aug 22 '14 at 10:32
16

I know this is an old question so the original poster is probably long gone but I still think it is worth answering as a resource to future searchers. The accepted answer from rcs does work, but I found it to be rather unstable and hacky. In the end I decided that a more modest but more stable approach is in order. With this method you can only change the background but that suffices for my purposes and might for others, my approach is to use geom_rect to recolour the background, like so:

highlights <- data.frame(cyl=c(8))

ggplot() + 
  geom_rect(data=highlights,aes(xmin=-Inf, xmax=Inf, ymin=-Inf, ymax=Inf), fill='red', alpha=0.2) +
  geom_bar(data = mtcars, aes(x=gear), position="dodge", fill = 'black') +
  facet_wrap(~cyl)

Example plot

Jack Aidley
  • 19,439
  • 7
  • 43
  • 70
  • Shouldn't `xmin=-Inf` etc be outside `aes`? – jf328 Dec 02 '19 at 01:27
  • @jf328 Hmm, maybe? It'll work either way, so there's no need to put them inside the `aes`, but I tend to do it that way anyway because I'm used to putting x, y, etc. inside the `aes` and it feels more consistent. But you could equally argue that because the `aes` is redundant it should be dropped. – Jack Aidley Dec 02 '19 at 12:29
4

This might help you get a little bit closer to what you want:

mtcars2 = subset(mtcars, cyl != 8)
   subs = subset(mtcars, cyl == 8)

require(ggplot2)
ggplot(mtcars2, aes(x=gear)) + 
    geom_bar(aes(y=gear, fill = 'black'), stat="identity", position="dodge") +
    geom_bar(data = subs, aes(x = gear), fill = 'blue', binwidth = 1) +
    facet_wrap(~cyl)
baha-kev
  • 3,029
  • 9
  • 33
  • 31