I wrote the following code in R
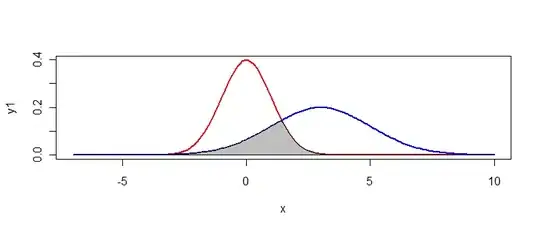
x=seq(-7,10,length=200)
y1=dnorm(x,mean=0,sd=1)
plot(x,y1,type="l",lwd=2,col="red")
y2=dnorm(x,mean=3,sd=2)
lines(x,y2,type="l",lwd=2,col="blue")
How can I shade the area under both curves (known as the overlap between the two curves).
I will highly appreciate any suggestions.