523

I have a data structure that represents a directed graph, and I want to render that dynamically on an HTML page. These graphs will usually be just a few nodes, maybe ten at the very upper end, so my guess is that performance isn't going to be a big deal. Ideally, I'd like to be able to hook it in with jQuery so that users can tweak the layout manually by dragging the nodes around.

Note: I'm not looking for a charting library.

Tim Post
  • 33,371
  • 15
  • 110
  • 174
Chris Farmer
  • 24,974
  • 34
  • 121
  • 164

4 Answers4

1000

I've just put together what you may be looking for: http://www.graphdracula.net

It's JavaScript with directed graph layouting, SVG and you can even drag the nodes around. Still needs some tweaking, but is totally usable. You create nodes and edges easily with JavaScript code like this:

var g = new Graph();
g.addEdge("strawberry", "cherry");
g.addEdge("cherry", "apple");
g.addEdge("id34", "cherry");

I used the previously mentioned Raphael JS library (the graffle example) plus some code for a force based graph layout algorithm I found on the net (everything open source, MIT license). If you have any remarks or need a certain feature, I may implement it, just ask!


You may want to have a look at other projects, too! Below are two meta-comparisons:

  • SocialCompare has an extensive list of libraries, and the "Node / edge graph" line will filter for graph visualization ones.

  • DataVisualization.ch has evaluated many libraries, including node/graph ones. Unfortunately there's no direct link so you'll have to filter for "graph":Selection DataVisualization.ch
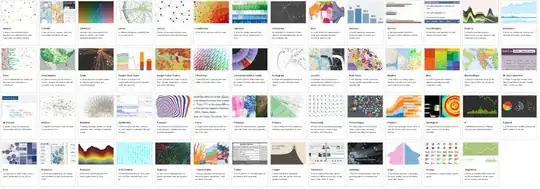
Here's a list of similar projects (some have been already mentioned here):

Pure JavaScript Libraries

  • vis.js supports many types of network/edge graphs, plus timelines and 2D/3D charts. Auto-layout, auto-clustering, springy physics engine, mobile-friendly, keyboard navigation, hierarchical layout, animation etc. MIT licensed and developed by a Dutch firm specializing in research on self-organizing networks.

  • Cytoscape.js - interactive graph analysis and visualization with mobile support, following jQuery conventions. Funded via NIH grants and developed by by @maxkfranz (see his answer below) with help from several universities and other organizations.

  • The JavaScript InfoVis Toolkit - Jit, an interactive, multi-purpose graph drawing and layout framework. See for example the Hyperbolic Tree. Built by Twitter dataviz architect Nicolas Garcia Belmonte and bought by Sencha in 2010.

  • D3.js Powerful multi-purpose JS visualization library, the successor of Protovis. See the force-directed graph example, and other graph examples in the gallery.

  • Plotly's JS visualization library uses D3.js with JS, Python, R, and MATLAB bindings. See a nexworkx example in IPython here, human interaction example here, and JS Embed API.

  • sigma.js Lightweight but powerful library for drawing graphs

  • jsPlumb jQuery plug-in for creating interactive connected graphs

  • Springy - a force-directed graph layout algorithm

  • JS Graph It - drag'n'drop boxes connected by straight lines. Minimal auto-layout of the lines.

  • RaphaelJS's Graffle - interactive graph example of a generic multi-purpose vector drawing library. RaphaelJS can't layout nodes automatically; you'll need another library for that.

  • JointJS Core - David Durman's MPL-licensed open source diagramming library. It can be used to create either static diagrams or fully interactive diagramming tools and application builders. Works in browsers supporting SVG. Layout algorithms not-included in the core package

  • mxGraph Previously commercial HTML 5 diagramming library, now available under Apache v2.0. mxGraph is the base library used in draw.io.

Commercial libraries

Abandoned libraries

  • Cytoscape Web Embeddable JS Network viewer (no new features planned; succeeded by Cytoscape.js)

  • Canviz JS renderer for Graphviz graphs. Abandoned in Sep 2013.

  • arbor.js Sophisticated graphing with nice physics and eye-candy. Abandoned in May 2012. Several semi-maintained forks exist.

  • jssvggraph "The simplest possible force directed graph layout algorithm implemented as a Javascript library that uses SVG objects". Abandoned in 2012.

  • jsdot Client side graph drawing application. Abandoned in 2011.

  • Protovis Graphical Toolkit for Visualization (JavaScript). Replaced by d3.

  • Moo Wheel Interactive JS representation for connections and relations (2008)

  • JSViz 2007-era graph visualization script

  • dagre Graph layout for JavaScript

Non-Javascript Libraries

kjagiello
  • 8,269
  • 2
  • 31
  • 47
  • 4
    Yes, directed edges are possible! Use g.addEdge("cherry", "apple", {"directed":true}); – Johann Philipp Strathausen Oct 19 '10 at 17:29
  • need to add also chart.js & chartnew.js library . and this (http://charts.livegap.com) is generate for it – Omar Sedki Mar 10 '15 at 07:43
  • I cannot edit but here is [Almende](http://almende.github.io/vis/examples/network/index.html). I have made a [visual dictionary](http://valtih1978.github.io/VisualDict/almende-vis.html), based on it. – Val Mar 28 '15 at 08:44
  • @JohannPhilippStrathausen Is there a way,I could add an event handler for a node? I want to capture the `X,Y` coordinates for each node. `(for graphdracula)` – Suhail Gupta Mar 29 '15 at 14:04
  • [ZoomCharts](http://ZoomCharts.com) does nice graph visualization using net chart component. – jancha Jun 26 '15 at 14:33
  • GraphDracula itself seems to be dead (it hasn't been updated in over three years). Can we add it to the "Abandoned libraries" list? – machineghost Sep 01 '16 at 20:55
  • It's not dead. I just released a few new versions recently, check for the posts and github profile please. – Johann Philipp Strathausen Sep 02 '16 at 14:04
  • Nice review, upwoted. Also there is [react-sigmajs](https://www.npmjs.com/package/react-sigmajs) - React components for SigmaJS, quite easy to use – Max Vorobjev Dec 09 '16 at 17:03
  • Can I determine the position of a Node by code? (Redrawing at random positions as in show case is not what most people would expect!) – forsberg Jan 28 '17 at 08:41
  • 1
    There are two more noteworthy libraries that can be added to the list, namely [Linkuroius.js](https://github.com/Linkurious/linkurious.js/) and [VivaGraphJS](https://github.com/anvaka/VivaGraphJS). – Łukasz K Jun 17 '17 at 18:05
  • 2
    Is there any open source alternative for yFILES layout algorithm ? Such as https://www.yworks.com/products/yfiles-layout-algorithms-for-cytoscape – Ryan Chou Oct 18 '17 at 15:25
  • 1
    I've made a free and lightweight library that may be useful to others: https://github.com/n-yousefi/Arg-Graph – n.y Apr 09 '18 at 08:41
  • I started my own library, I try to keep easy use. https://github.com/lmoraobando/lmDiagram/tree/Dev – Leonardo Mora Jul 10 '20 at 18:53
  • which is the most easiest to use for network graph? – Nur Dec 10 '21 at 14:45
54

Disclaimer: I'm a developer of Cytoscape.js

Cytoscape.js is a HTML5 graph visualisation library. The API is sophisticated and follows jQuery conventions, including

  • selectors for querying and filtering (cy.elements("node[weight >= 50].someClass") does much as you would expect),
  • chaining (e.g. cy.nodes().unselect().trigger("mycustomevent")),
  • jQuery-like functions for binding to events,
  • elements as collections (like jQuery has collections of HTMLDomElements),
  • extensibility (can add custom layouts, UI, core & collection functions, and so on),
  • and more.

If you're thinking about building a serious webapp with graphs, you should at least consider Cytoscape.js. It's free and open-source:

http://js.cytoscape.org

maxkfranz
  • 11,896
  • 1
  • 27
  • 36
  • 6
    All APIs are fully documented. The docs even step you through getting started (i.e. init). There are *also* running examples for the individual APIs, and there are live demos. The functionality is far above any JS graph lib and the docs are more extensive than most projects -- whether commercial or opensource. What exactly is lacking for you in the docs? – maxkfranz Mar 13 '15 at 21:02
  • Does it have a way to layout graphs in a hierarchical order(a layout that looks like a tree but it is in fact a graph , meaning there are nodes with multiple parents) – Mina May 09 '16 at 21:43
  • Both the dagre and the breadthfirst layout work for that case – maxkfranz May 12 '16 at 16:11
  • I need to edit the graph with drag'n'drop of arrows begin ends and end ends. This library says those things are immutable. So I need to seek for another library... – Eugene Gr. Philippov Jul 07 '16 at 13:34
  • Immutability does not mean inflexibility -- it just tends to keep things reliable and consistent . See [`eles.move()`](http://js.cytoscape.org/#eles.move) and the following [extensions](http://js.cytoscape.org/#extensions): [`edgehandles`](https://github.com/cytoscape/cytoscape.js-edgehandles), [`edge-editation`](https://github.com/frankiex/cytoscape.js-edge-editation), [`edge-bend-editing`](https://github.com/iVis-at-Bilkent/cytoscape.js-edge-bend-editing) – maxkfranz Jul 07 '16 at 15:12
10

In a commercial scenario, a serious contestant for sure is yFiles for HTML:

It offers:

  • Easy import of custom data (this interactive online demo seems to pretty much do exactly what the OP was looking for)
  • Interactive editing for creating and manipulating the diagrams through user gestures (see the complete editor)
  • A huge programming API for customizing each and every aspect of the library
  • Support for grouping and nesting (both interactive, as well as through the layout algorithms)
  • Does not depend on a specfic UI toolkit but supports integration into almost any existing Javascript toolkit (see the "integration" demos)
  • Automatic layout (various styles, like "hierarchic", "organic", "orthogonal", "tree", "circular", "radial", and more)
  • Automatic sophisticated edge routing (orthogonal and organic edge routing with obstacle avoidance)
  • Incremental and partial layout (adding and removing elements and only slightly or not at all changing the rest of the diagram)
  • Support for grouping and nesting (both interactive, as well as through the layout algorithms)
  • Implementations of graph analysis algorithms (paths, centralities, network flows, etc.)
  • Uses HTML 5 technologies like SVG+CSS and Canvas and modern Javascript leveraging properties and other more ES5 and ES6 features (but for the same reason will not run in IE versions 8 and lower).
  • Uses a modular API that can be loaded on-demand using UMD loaders

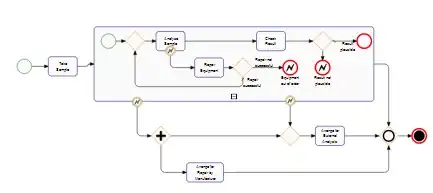
Here is a sample rendering that shows most of the requested features:

Screenshot of a sample rendering created by the BPMN demo.

Full disclosure: I work for yWorks, but on Stackoverflow I do not represent my employer.

Sebastian
  • 7,729
  • 2
  • 37
  • 69
  • 4
    The best collection of algorithms, but also the most closed, making it impossible to use in open-source projects :-( – forresto Mar 14 '14 at 11:55
  • 1
    "Best collection" is probably true, but "most closed" is relative, and "impossible" is incorrect: It's a commercial license, so unless the open-source project uses a [viral license](http://en.wikipedia.org/wiki/Viral_license), it *can* be used in open-source projects. Of course using open-source projects in other open-source projects *is* less problematic... – Sebastian Nov 20 '14 at 07:15
  • 1
    You seem to not understand how open source works. Are you saying that your company can grant an open-source project the right to use this software for infinite developers, the right to distribute it to infinite developers and contributors and testers, for a fixed, one-time cost? [Of course not](http://www.yworks.com/en/products_yfileshtml_commercialinfo_licensetypes.html). – Félix Saparelli Jun 03 '15 at 23:22
  • 2
    @FélixSaparelli : Believe me: I do. What you describe is possible and similar things have been done before. You are linking to the standard license terms, but of course custom agreements are possible and have been made before. This is not the right place to discuss this, though. Feel free to contact yWorks directly. – Sebastian Jun 05 '15 at 14:10
7

As guruz mentioned, the JIT has several lovely graph/tree layouts, including quite appealing RGraph and HyperTree visualizations.

Also, I've just put up a super simple SVG-based implementation at github (no dependencies, ~125 LOC) that should work well enough for small graphs displayed in modern browsers.

YakovL
  • 7,557
  • 12
  • 62
  • 102
Jack Rusher
  • 186
  • 2
  • 5