15

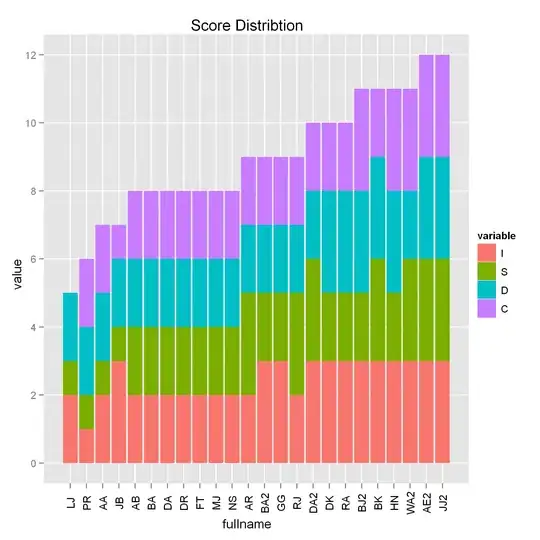
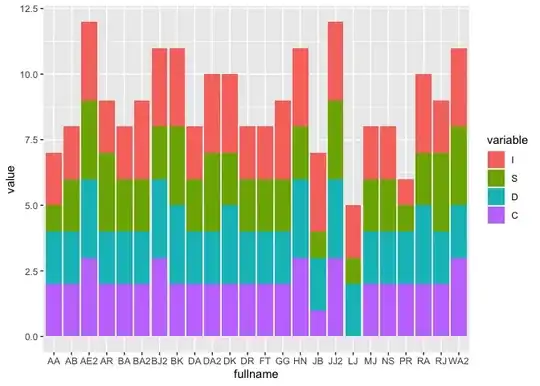
My colleague and I are trying to order a stacked bar graph based on the y-values instead of alphabetically by the x-values.

The sample data is:

library(ggplot2)
samp.data <- structure(list(fullname = c("LJ", "PR", 
                                         "JB", "AA", "NS", 
                                         "MJ", "FT", "DA", "DR", 
                                         "AB", "BA", "RJ", "BA2", 
                                         "AR", "GG", "RA", "DK", 
                                         "DA2", "BJ2", "BK", "HN", 
                                         "WA2", "AE2", "JJ2"), I = c(2L, 
                                                                     1L, 3L, 2L, 2L, 2L, 2L, 2L, 2L, 2L, 2L, 2L, 3L, 2L, 3L, 3L, 3L, 
                                                                     3L, 3L, 3L, 3L, 3L, 3L, 3L), S = c(1L, 1L, 1L, 1L, 2L, 2L, 2L, 
                                                                                                        2L, 2L, 2L, 2L, 3L, 2L, 3L, 2L, 2L, 2L, 3L, 2L, 3L, 2L, 3L, 3L, 
                                                                                                        3L), D = c(2L, 2L, 2L, 2L, 2L, 2L, 2L, 2L, 2L, 2L, 2L, 2L, 2L, 
                                                                                                                   2L, 2L, 3L, 3L, 2L, 3L, 3L, 3L, 2L, 3L, 3L), C = c(0L, 2L, 1L, 
                                                                                                                                                                      2L, 2L, 2L, 2L, 2L, 2L, 2L, 2L, 2L, 2L, 2L, 2L, 2L, 2L, 2L, 3L, 
                                                                                                                                                                      2L, 3L, 3L, 3L, 3L)), .Names = c("fullname", "I", "S", "D", "C"
                                                                                                                                                                      ), class = "data.frame", row.names = c(NA, 24L))
md <- reshape2::melt(samp.data, id = (c("fullname")))
ggplot(data = md, aes(x = fullname, y = value, fill = variable)) +
  geom_col()

But I ultimately want to sort by the sum of the 4 variables (I, S, D, and C) instead of the alphabetical order of the fullnames.

tjebo
  • 21,977
  • 7
  • 58
  • 94
Jeff Erickson
  • 3,783
  • 8
  • 36
  • 43
  • 1
    here is the way to order the factor by sum of each level: `md$fullname <- factor(md$fullname, levels = arrange(ddply(md, .(fullname), summarize, s = sum(value)), desc(s))$fullname)` – kohske Nov 18 '11 at 17:41

2 Answers2

24

The general (non ggplot-specific) answer is to use reorder() to reset the factor levels in a categorical column, based on some function of the other columns.

## Examine the default factor order
levels(samp.data$fullname)

## Reorder fullname based on the the sum of the other columns
samp.data$fullname <- reorder(samp.data$fullname, rowSums(samp.data[-1]))

## Examine the new factor order
levels(samp.data$fullname)
attributes(samp.data$fullname)

Then just replot, using code from the original question

md <- melt(samp.data, id=(c("fullname")))
temp.plot<-ggplot(data=md, aes(x=fullname, y=value, fill=variable) ) + 
               geom_bar()+ 
               theme(axis.text.x=theme_text(angle=90)) + 
               labs(title = "Score Distribtion")
## ggsave(temp.plot,filename="test.png")

enter image description here

Axeman
  • 32,068
  • 8
  • 81
  • 94
Josh O'Brien
  • 159,210
  • 26
  • 366
  • 455
  • Thanks! I will accept in a few minutes when it will let me. Just for my own knowledge, why does the sorting of the pre-melted dataframe not get lost once the data is melted? Thank you! – Jeff Erickson Nov 18 '11 at 17:43
  • Oh I think I understand. The melt function spits it out in the same order as was in the pre-melted data and it just never changes. ggplot just picks up this order. Does that sound correct? – Jeff Erickson Nov 18 '11 at 17:46
  • 1
    Its actually a better/stabler solution than that. As a `factor`, `fullname` has a `levels` attribute attached to it. It keeps track of the order of the levels, regardless of the order of the data themselves. To learn more, have a look at the output of `attributes(samp.data$fullname)` and `levels(samp.data$fullname)`, both before and after the reordering. – Josh O'Brien Nov 18 '11 at 17:53
2

A much simpler solution is to change the underlying function in reorder:

ggplot(data = md, aes(x = reorder(fullname, value, sum), y = value, fill = variable)) +
  geom_col()

tjebo
  • 21,977
  • 7
  • 58
  • 94