193

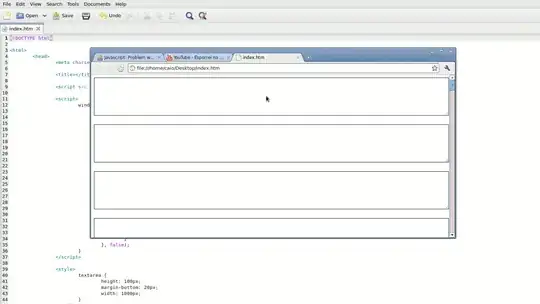
The code below produces gaps between the subplots. How do I remove the gaps between the subplots and make the image a tight grid?

enter image description here

import matplotlib.pyplot as plt

for i in range(16):
    i = i + 1
    ax1 = plt.subplot(4, 4, i)
    plt.axis('on')
    ax1.set_xticklabels([])
    ax1.set_yticklabels([])
    ax1.set_aspect('equal')
    plt.subplots_adjust(wspace=None, hspace=None)
plt.show()
Trenton McKinney
  • 56,955
  • 33
  • 144
  • 158
user3006135
  • 2,747
  • 4
  • 15
  • 11
  • 2
    post a link and it can be edited in. `None` is not doing what you think, it means 'use the default'. – tacaswell Nov 18 '13 at 21:10
  • I tried adding numbers instead of 'None' but this didn't solve the prolem. – user3006135 Nov 18 '13 at 21:56
  • 6
    `plt.subplots_adjust(wspace=0, hspace=0)` would solve your problem, were it not for the fact that you use `'equal'` aspect. See my answer for details. – apdnu Mar 17 '16 at 00:46

7 Answers7

241

The problem is the use of aspect='equal', which prevents the subplots from stretching to an arbitrary aspect ratio and filling up all the empty space.

Normally, this would work:

import matplotlib.pyplot as plt

ax = [plt.subplot(2,2,i+1) for i in range(4)]

for a in ax:
    a.set_xticklabels([])
    a.set_yticklabels([])

plt.subplots_adjust(wspace=0, hspace=0)

The result is this:
However, with aspect='equal', as in the following code:

import matplotlib.pyplot as plt

ax = [plt.subplot(2,2,i+1) for i in range(4)]

for a in ax:
    a.set_xticklabels([])
    a.set_yticklabels([])
    a.set_aspect('equal')

plt.subplots_adjust(wspace=0, hspace=0)

This is what we get:

The difference in this second case is that you've forced the x- and y-axes to have the same number of units/pixel. Since the axes go from 0 to 1 by default (i.e., before you plot anything), using aspect='equal' forces each axis to be a square. Since the figure is not a square, pyplot adds in extra spacing between the axes horizontally.

To get around this problem, you can set your figure to have the correct aspect ratio. We're going to use the object-oriented pyplot interface here, which I consider to be superior in general:

import matplotlib.pyplot as plt

fig = plt.figure(figsize=(8,8)) # Notice the equal aspect ratio
ax = [fig.add_subplot(2,2,i+1) for i in range(4)]

for a in ax:
    a.set_xticklabels([])
    a.set_yticklabels([])
    a.set_aspect('equal')

fig.subplots_adjust(wspace=0, hspace=0)

Here's the result:
apdnu
  • 6,717
  • 5
  • 24
  • 24
  • 5
    I tried this but it still get a vertical gap between each column of images.. and set_aspect('equal') doesn't change anything for me – Luan Souza Jul 22 '21 at 13:33
  • If you just need a raster graphic, you can open it in Gimp and Use *Image* → *Zealous Crop*. However, I did this for switched off axes `a.axis('off')`. Otherwise the ticks can be in the way. – John Aug 24 '21 at 15:59
130

You can use gridspec to control the spacing between axes. There's more information here.

import matplotlib.pyplot as plt
import matplotlib.gridspec as gridspec

plt.figure(figsize = (4,4))
gs1 = gridspec.GridSpec(4, 4)
gs1.update(wspace=0.025, hspace=0.05) # set the spacing between axes. 

for i in range(16):
   # i = i + 1 # grid spec indexes from 0
    ax1 = plt.subplot(gs1[i])
    plt.axis('on')
    ax1.set_xticklabels([])
    ax1.set_yticklabels([])
    ax1.set_aspect('equal')

plt.show()

axes very close together

Amund
  • 72
  • 8
Molly
  • 13,240
  • 4
  • 44
  • 45
71

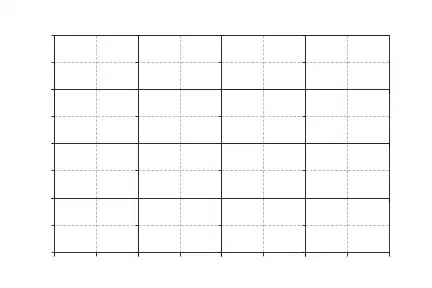
Without resorting gridspec entirely, the following might also be used to remove the gaps by setting wspace and hspace to zero:

import matplotlib.pyplot as plt

plt.clf()
f, axarr = plt.subplots(4, 4, gridspec_kw = {'wspace':0, 'hspace':0})

for ax in axarr.flatten():
    ax.grid('on', linestyle='--')
    ax.set_xticklabels([])
    ax.set_yticklabels([])

plt.show()
plt.close()

Resulting in:

.

Rainald62
  • 706
  • 12
  • 19
Herpes Free Engineer
  • 2,425
  • 2
  • 27
  • 34
15

With recent matplotlib versions you might want to try Constrained Layout. This does (or at least did) not work with plt.subplot() however, so you need to use plt.subplots() instead:

fig, axs = plt.subplots(4, 4, constrained_layout=True)
Michel de Ruiter
  • 7,131
  • 5
  • 49
  • 74
8

Have you tried plt.tight_layout()?

with plt.tight_layout() enter image description here without it: enter image description here

Or: something like this (use add_axes)

left=[0.1,0.3,0.5,0.7]
width=[0.2,0.2, 0.2, 0.2]
rectLS=[]
for x in left:
   for y in left:
       rectLS.append([x, y, 0.2, 0.2])
axLS=[]
fig=plt.figure()
axLS.append(fig.add_axes(rectLS[0]))
for i in [1,2,3]:
     axLS.append(fig.add_axes(rectLS[i],sharey=axLS[-1]))    
axLS.append(fig.add_axes(rectLS[4]))
for i in [1,2,3]:
     axLS.append(fig.add_axes(rectLS[i+4],sharex=axLS[i],sharey=axLS[-1]))
axLS.append(fig.add_axes(rectLS[8]))
for i in [5,6,7]:
     axLS.append(fig.add_axes(rectLS[i+4],sharex=axLS[i],sharey=axLS[-1]))     
axLS.append(fig.add_axes(rectLS[12]))
for i in [9,10,11]:
     axLS.append(fig.add_axes(rectLS[i+4],sharex=axLS[i],sharey=axLS[-1]))

If you don't need to share axes, then simply axLS=map(fig.add_axes, rectLS) enter image description here

CT Zhu
  • 52,648
  • 17
  • 120
  • 133
  • 1
    I tried tight layout, but it didn't get rid of the gaps, which is what I want. The gridspec solution worked. Thank you for the suggestions. – user3006135 Nov 18 '13 at 22:02
  • This worked great in conjunction with the other suggestions. tight_layout() helped remove the white space above and to the sides of the plot that served no purpose. – DChaps Feb 02 '20 at 04:23
8

Another method is to use the pad keyword from plt.subplots_adjust(), which also accepts negative values:

import matplotlib.pyplot as plt

ax = [plt.subplot(2,2,i+1) for i in range(4)]

for a in ax:
    a.set_xticklabels([])
    a.set_yticklabels([])

plt.subplots_adjust(pad=-5.0)

Additionally, to remove the white at the outer fringe of all subplots (i.e. the canvas), always save with plt.savefig(fname, bbox_inches="tight").

MERose
  • 4,048
  • 7
  • 53
  • 79
0

Matplotlib will check the "subplotpars" param to define subplot positions. So this should work:

left   = 0.03 #The position of the left edge of the subplots, as a fraction of the figure width.
bottom = 0.05 #The position of the bottom edge of the subplots, as a fraction of the figure height.
right  = 0.99 #The position of the right edge of the subplots, as a fraction of the figure width.
top    = 0.97 #The position of the top edge of the subplots, as a fraction of the figure height.
wspace = None #The width of the padding between subplots, as a fraction of the average Axes width.
hspace = None #The height of the padding between subplots, as a fraction of the average Axes height.

fig.subplotpars.update(left, bottom, right, top, wspace, hspace)

You may adjust the parameters above individually(between 0 and 1) for your needs.

Fernando
  • 1
  • 2