For a JPEG image you can use the jpeg library and ggplot2 library.
Usually I found useful to have the axis graduated in pixel and the vertical axis going positive in the downward direction and the picture keeping its original aspect ratio. So I can feed R directly with the output produced by computer vision algorithm, for example the algorithm can detect the bullet hole and extract the hole coordinates from a shooting target picture and then R can plot a 2D histogram using the target image as background.
My code is based on code by baptiste found at https://stackoverflow.com/a/16418186/15485
library(ggplot2)
library(jpeg)
img <- readJPEG("bersaglio.jpg") # http://www.tiropratico.com/bersagli/forme/avancarica.jpg
h<-dim(img)[1] # image height
w<-dim(img)[2] # image width
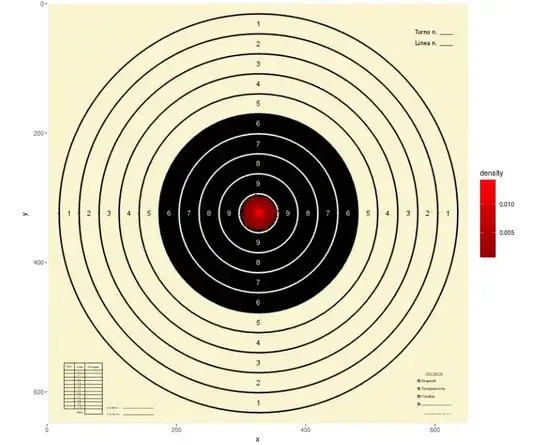
df<-data.frame(x=rnorm(100000,w/1.99,w/100),y=rnorm(100000,h/2.01,h/97))
plot(ggplot(df, aes(x,y)) +
annotation_custom(grid::rasterGrob(img, width=unit(1,"npc"), height=unit(1,"npc")), 0, w, 0, -h) + # The minus is needed to get the y scale reversed
scale_x_continuous(expand=c(0,0),limits=c(0,w)) +
scale_y_reverse(expand=c(0,0),limits=c(h,0)) + # The y scale is reversed because in image the vertical positive direction is typically downward
# Also note the limits where h>0 is the first parameter.
coord_equal() + # To keep the aspect ratio of the image.
stat_bin2d(binwidth=2,aes(fill = ..density..)) +
scale_fill_gradient(low = "dark red", high = "red")
)
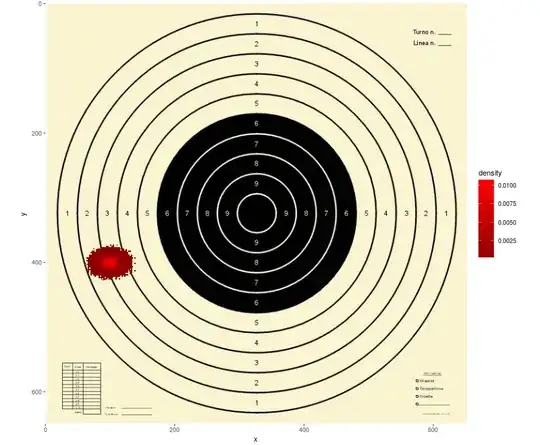
df<-data.frame(x=rnorm(100000,100,w/70),y=rnorm(100000,400,h/100))
plot(ggplot(df, aes(x,y)) +
       annotation_custom(grid::rasterGrob(img, width=unit(1,"npc"), height=unit(1,"npc")), 0, w, 0, -h) + # The minus is needed to get the y scale reversed
       scale_x_continuous(expand=c(0,0),limits=c(0,w)) +
       scale_y_reverse(expand=c(0,0),limits=c(h,0)) + # The y scale is reversed because in image the vertical positive direction is typically downward
       # Also note the limits where h>0 is the first parameter.
       coord_equal() + # To keep the aspect ratio of the image.

       stat_bin2d(binwidth=2,aes(fill = ..density..)) +
       scale_fill_gradient(low = "dark red", high = "red")
)