2

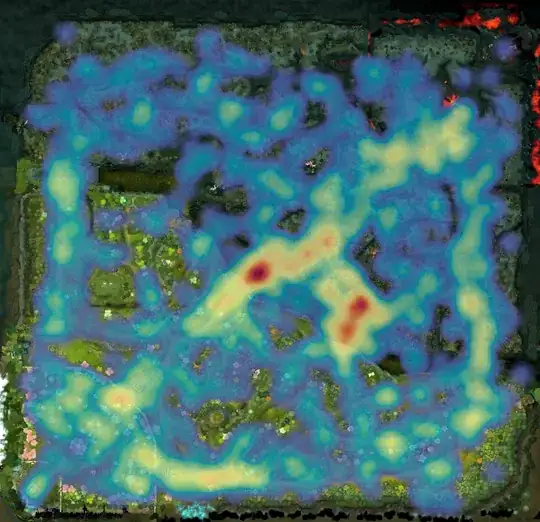
I'd like to generate heatmaps pretty much like the ones in this article:

http://www.gazehawk.com/blog/experienced-users-view-reddit-differently/

The answers in this question are not entirely satisfactory because the heatmaps is generated with very naive python code, which is very slow for large heatmaps with a large number of points.

So, any faster, more flexible and easier solution? It can be any language, I don't care.

Community
  • 1
  • 1
static_rtti
  • 53,760
  • 47
  • 136
  • 192

3 Answers3

3

http://www.patrick-wied.at/static/heatmapjs/
https://github.com/sunng87/heatcanvas/

Kracekumar
  • 19,457
  • 10
  • 47
  • 56
  • Yeah, could you add some text to your answer instead of only two links? – Paŭlo Ebermann Jul 30 '11 at 13:59
  • 1
    @static_rtti: I have not used in production, saw the source code and demo , it is promising, have a loot at this http://sunng.info/blog/2011/06/openlayers-extension-for-heatcanvas/, – Kracekumar Jul 30 '11 at 14:30
  • @Paŭlo Ebermann: at least, unlike you, he provided a useful answer. – static_rtti Jul 30 '11 at 15:21
  • 1
    @static_rtti: I do not know anything about heatmap generation ... if I knew, I had written my own answer. My comment here is not to be seen as an attack, but as a request to get a better answer. Sorry if it sounded wrong. – Paŭlo Ebermann Jul 30 '11 at 15:27
  • @Paŭlo Ebermann: no problem, I just think your time would be better spent actually answering questions :) – static_rtti Jul 30 '11 at 15:54
  • @static: If you look at [my activity](http://stackoverflow.com/users/600500/paulo-ebermann?tab=activity#apage_1-afilter_posts), you'll see that I'm doing this enough ... but to keep this site a high-quality-one, it also needs some housekeeping, like commenting to make other's answers better. (I'll finish now.) – Paŭlo Ebermann Jul 30 '11 at 15:59
3

I think the problem have 2 steps: generate array a[i,j] for heatmap, and plot it using density plot. The array can be generated as result of: (1) smoothing of an array with random values, or (2) Fourier transforming of array with random values. Second way will give you smoother ("nicer") and controllable result. Especially if you change the amplitudes of random harmonics depending its numbers.

Both this steps can be done in MathGL -- free (GPL, and partially LGPL) cross-platform plotting library. It is written in C++ ... So, it is fast enough.

abalakin
  • 825
  • 7
  • 6
0

This is a shameless plug, but I have written a heatmap library exactly because of the reasons you mention.

It's fast, portable and easy to call from any language (it's ANSI C without dependencies) as well as flexible in that you can create custom colorschemes, "stamps", point resolutions, etc.

Probably the only drawback is that it's not using the GPU (by design, I had to run it on a headless server) so while it's reasonably fast, it's still slower than GPU-based ones!

Example: example heatmap

LucasB
  • 3,253
  • 1
  • 28
  • 31